
Sustainability of the built environment:
water and the maintenance of life.
Stephen Butcher1
1Harwood, Carterton, New Zealand
(Published on Web 02/10/2009)
ABSTRACT: The aim of this study is to review an EPA study which showed a link between chlorinated water and heart failure, and no link between pH adjustment using lime and heart failure. The method was to use epidemiology and control for pH and ionisation separately. Sources of ionisation are identified as pH adjustment using lime and water pipe ionisation caused by failure to bond supply transformer earths and water pipes equipotentially. The results show that there is a clear dose response to pH adjustment using lime, but no dose response to chlorine. Additionally, the parallel but offset incidence of cancer is identified as also being dose related. The conclusion is that treated water should be buffered rather than pH adjusted, and that water pipes should be isolated or, in the interim, equipotentially bonded to transformer earths.
Conference Theme: Urban
Keywords: water pipes, ions, heart failure.
INTRODUCTION
The theme for this 2009 ANZAScA conference takes a broader approach to building science by encouraging a relaxation of the subject boundaries normally associated with the various professions involved in building and building science, and allows papers across disciplines. Such a relaxation allows for research to produce a more coherent result for the built environment.
This paper involves three main disciplines and their interaction; the building services of water treatment (chemistry) and electricity supply (electrical engineering), and building health (public health).
1. BACKGROUND
1.1 Early history of water treatment
In 1849 Dr John Snow first published his paper "On the Mode of Communication of Cholera" in which he set out a connection between drinking water and cholera. His paper was largely ignored in favour of the prevailing belief, the so-called 'miasma theory,' that cholera was spread by an airborne mist and could be controlled by eradicating odours.
Snow was found post-humously to be correct. Subsequently, in 1883, Robert Koch identified the cholera bacillus.
Snow used chlorine in an attempt to disinfect the Broad Street pump which was the focus of his research in the third wave of cholera in 1853.
In the United States, the first municipal chlorination was in 1908 and chlorination was quickly taken up as a guarantee that bacteria, such as cholera and typhoid, could not continue to create the epidemics that had heralded the start of the industrial revolution.
1.2 EPA research on chlorine
While chlorine is now regarded as a normal part of water treatment, research continues to look at possible side effects. Some of this research suggests that a correlation exists between chlorine and heart failure.
p1
In 1986 the United States Environmental Protection Agency (EPA) in partnership with the Oakridge Research Institute published a report, the "Relationship of drinking water disinfectants to plasma cholesterol and thyroid hormone levels in experimental studies" (1) in which they mention earlier research:
The health benefits associated with chlorination are well established, but the possibility of harmful effects also exists. For instance, recent studies suggest that hepatotoxins and carcinogens may be generated during chlorination. The compounds generated include chlorinated organics such as chloroform and other trihalomethanes, both of which have been observed in drinking water treated with chlorine. Chlorination of foods and drinking water have been associated with cardiovascular abnormalities. For example, the chlorination of flour is associated with the formation of chlorinated fatty acids, and, in animals fed these fatty acids, significant increases in heart weight have been observed. Revis et al. have observed hypercholesterolemia and cardiac hypertrophy in pigeons and rabbits exposed to chlorinated drinking water. Taken together, these results suggest that chlorine and/or formed chlorinated products may adversely affect the cardiovascular system through the well-known association of plasma cholesterol levels with atherosclerosis and hypertension with cardiac hypertrophy.
While 1983 may not seem to be the most current research, it does point to the involvement of chlorine byproducts, such as trihalomethanes, in heart failure. Much of today's water testing regime for recticulated water involves the monitoring of chlorine byproducts and it is never untimely to question the validity of the research on which this monitoring is based.
The EPA study looked at cholesterol, pH and chlorine as 3 variables, and suggested that:
Significant increases in plasma cholesterol were observed in pigeons given the various drinking water disinfectants. However, a clear dose-response effect was not observed, although pigeons were more responsive when given the 15-ppm dose and the high-cholesterol diet or 2 ppm and the normal diet. In pigeons fed the normal diet, chlorine (pH 8.5) and chlorine dioxide (2 ppm) were both effective in the induction of an increase in plasma cholesterol, whereas in the high cholesterol diet studies, three disinfectants [i.e., 15 ppm chlorine (pH 8.5), chlorine dioxide, and monochloramine] were associated with significant increases in plasma cholesterol. Pigeons fed the two diets and exposed to chlorine (pH 6.5) showed insignificant increases in plasma cholesterol. Since the pH of the solutions containing chlorine, chlorine dioxide, and monochloramine ranged from 7.6 to 8.5, this suggests a relationship between pH, disinfectant dose, and plasma cholesterol.
It appears that only chlorine was tested with pH as a variable (6.5 and 8.5). The pH of chlorine dioxide and monochloramine were kept in the range 7.6 to 8.5, that is, significantly alkaline; but no comparison was made with cholesterol production at a lower pH around 6.5. A difference could be expected. Chlorine dioxide for instance, when added to alkaline water disproportionates to chlorite, chlorate and hydronium ions:
2ClO2 + 4H2O goes to ClO2- + ClO3- + H2O + 2H3O+ [1]
There appears to be no mention of how the pH was adjusted but it is assumed that lime was used, as is most commonly used in chlorinated water supplies. An earlier study by the EPA showed no effect on cholesterol where the pH was buffered to a range of alkaline values.
1.3 Buffering versus pH adjustment
Buffering is the substitution of a strong acid with a weak one, whereas adjustment produces a bigger change in pH often with ions as by-products. For example, buffering with sodium bicarbonate can be compared with adjustment using lime, where the latter produces hydronium ions:
H2O + Cl2 goes to HCl + HOCl [2]
[water + chlorination] [hydrochloric acid + hypochlorous acid]
If buffered:
HCl (+ H2O) + NaHCO3 goes to H2CO3 + NaCl (+ H2O) [and H2CO3 to H2O + CO(g)] [3]
[hydrochloric acid + sodium bicarbonate] [carbonic acid + salt]
If adjusted:
2HCl + Ca(OH)2 goes to CaCl2 + 2H2O [4]
[hydrochloric acid + slaked lime] [calcium chloride + water]
p2
But some of the slaked lime from adjustment combines with absorbed carbon dioxide to form calcium carbonate as a precipitate, some of which is dissolved in the water, so:
Ca(OH)2 + CO2 goes to CaCO3 + H2O [5]
[calcium hydroxide + carbon dioxide] [lime + water]
At a pH of around 6.5:
2HCl + CaCO3 goes to H2CO3 + CaCl2 [6]
[hydrochloric acid + calcium carbonate] [carbonic acid + calcium chloride]
As the solution is made more alkaline:
H2O + H2CO3 partially goes to HCO3- + H3O+ [7]
[water + carbonic acid] [carbonate + hydronium]
The extra step when adjusted results from the greater change in pH compared to buffering.
It seems probable that the search for a clear dose response relationship in the EPA study was muddied by two factors:
(a) a lack of control over the pH of the disinfectants other than chlorine; and
(b) the use of pH adjustment rather than buffering.
The EPA paper concludes that:
In previous studies we have not observed significant changes in plasma cholesterol in pigeons exposed to deionized water buffered to pHs of 7.0, 7.5, 8.5, and 9.5. This suggests that it is the disinfectant itself rather than the pH of the drinking water that is responsible for the observed plasma cholesterol effect.
It seems far more likely that the difference in results between the two EPA studies relates to ions created by the different methods of pH control rather than the disinfectants per se, and the dismissal of pH was made unfairly.
This paper looks at the epidemiology of ionisation not properly controlled in the laboratory based EPA study.
1.4 Real world ionisation
One aspect of real world ionisation is the connection of power lines to water pipes which has been mandatory since around 1950. Low voltage (230V) transformers have an earth connected to their neutral and, similarly, any serviced building has it's neutral connected to earth by a bus bar link in the meterboard. Water pipes are also connected to that same earth and, therefore, the neutral conductor:
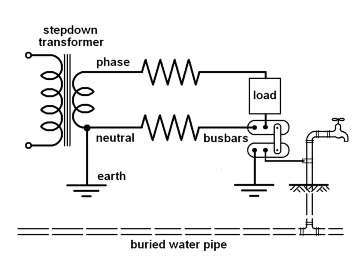
Source: S. Butcher 2009
Figure 1: ionisation circuit
There are several 'return' paths for AC power. The most obvious is the neutral wire but there is also ground conductance and capacitance, plus the circuit involving the water pipe.
p3
Ground has resistance, so the current will be shared by the neutral wire and ground in proportion to their respective resistances and potentials. Ground capacitance and ionisation can complete the circuit where neutral and ground resistances are high enough; for instance, in Single Wire Earth Return (SWER).
The water pipe is a good electrical conductor. However the return circuit must still be completed by conduction and/or ground capacitance between the water pipe and the transformer earth. Alternatively it could be completed by ionisation of both the water pipe and the transformer earth.
Ionisation occurs only at a negative electrode and, as AC power is alternating, both the water pipe and the transformer earth will be negatively ionised.
This could not occur if the transformer earth was equipotentially bonded to the water pipe. There is a legal requirement to bond the water pipe and the bus bars equipotentionally at an installation, but the same requirement does not apply to the network operator.
Proof of ionisation in a water pipe is the build up of iron, Fe2+, and manganese, Mn2+, on the pipe wall:

Source:www.corrview.com/corr_06.htm
Photo 1: ion adhesion
This ionisation is electrically induced.
In the process of water treatment ionisation is chemically induced. When chlorine is added to water, hydrochloric acid is produced which then dissociates to form hydrogen ions as hydronium, H3O+, as we have seen earlier. These ions are highly mobile as they bond to adjacent water molecules to form larger structures, such as zundel and eigen ions. These have stronger bonds at their core (2) and dislocations or broken bonds between themselves and the surrounding water matrix.
Ionisation, therefore, is a common factor between electric power and water treatment.
1.5 Hydronium, cholesterol and cancer
The control group in the EPA study showed an increase in plasma cholesterol over the 3 month study period, whereas in the previous study where buffering was used there was no increase. It may be that the control in the 1986 study also had it's control water pH adjusted. If so, there would have been a reaction with absorbed carbon dioxide in the water. Water partially absorbs carbon dioxide and partially forms carbonic acid in equilibrium at a pH of around 6.5. As water is made more alkaline some of the carbonic acid will become bicarbonate and hydronium ions as we have seen:
H2O + H2CO3 partially goes to HCO3- + H3O+ [8]
This points to ions being involved in escalating cholesterol production.
Hydronium occurs naturally in water by the process of self ionisation at a rate of 1 per 5.6 x 10⁸ molecules, but the above equations give several examples in which the rate of ionisation must be greatly increased.
Additionally, as cholesterol is used as a defence by the human body against cellular damage, then increasing plasma cholesterol would also correlate with increasing cancer rates.
p4
If so, then ionisation is a common factor not only with power and water but also with health.
This is supported by a study of District Health Boards (DHBs) in the North Island of New Zealand which shows that ischaemic heart failure and cancer rates parallel each other:
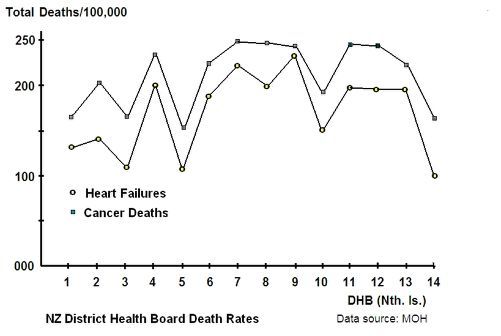

Graph 1: DHB heart failure and cancer
While there is a clear parallel between heart failure and cancer it should be noted that, historically and globally, the start of the respective increases are offset by about 40 years. The heart failure epidemic began post 1910 while the cancer epidemic began post 1950.
2. HYPOTHESIS
As AC power and pH adjustment using lime are both capable of forming ions, these ions and their modification may be involved in, and present as, both ischaemic heart failure and cancer. If so, then the EPA study's conclusion is incorrect and there is a clear dose response between ions and heart failure.
3. AIM
The aim of this paper is to study the epidemiology of ischaemic heart deaths in the North Island of New Zealand to see if a relationship between pH and ischaemic heart failure and cancer is dose related to pH adjustment using lime and to water pipe conductivity.
4. METHOD
A representative sample of Territorial Land Authorities (TLAs) over 30,000 people in the North Island of New Zealand were grouped according to the percentage of conductive water pipe and pH, and the largest groups used to look for any clear dose response.
Conductive water pipe and pH were controlled separately so that the behaviour of only one variable was observed at a time.
The resultant graphs were used to form an equation which included both varables and would therefore apply to all groups in the sample; that is, the full range of pH and percentage of conductive pipe.
p5
5. RESULTS
The first graph looks at the effect of conductive water pipe on heart failure, and controls for pH by keeping it within the range of 7.4 to 7.6:
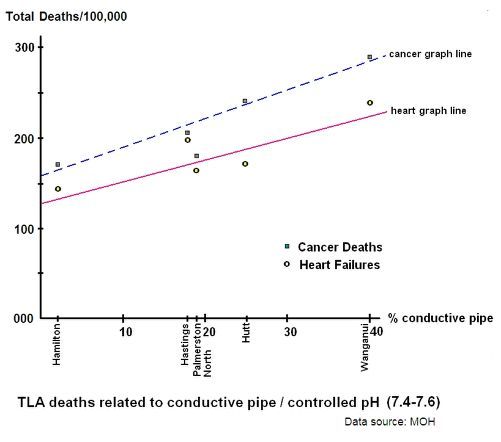
Graph 2: TLA heart failure from ionised water pipes
The next graph looks at the effect of pH on heart failure, and controls for pipe conductivity by keeping it within the range of 15% - 25%. This range is larger than that for pH, when it was controlled in the first graph, but the effect of pH is somewhat less than the effect of pipe conductivity:
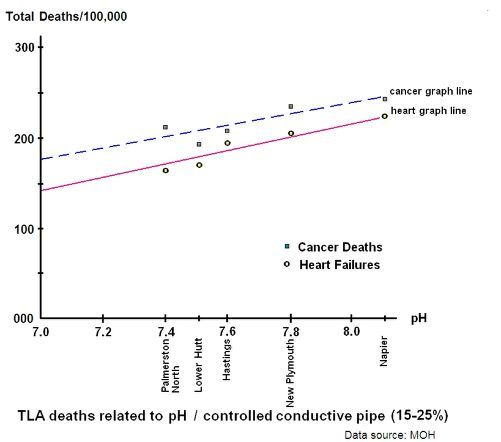
Graph 3: TLA heart failure from pH adjustment
These graphs for the North Island study can be approximated as an equation. To keep things simple we can use the general form y = mx + c to find the theoretical heart failure rate; where "m" is the slope of the graph, "x" is the variable and "c" is the y axis crossing point.
p6
The "c" value is the lowest value of heart failure in our sample towns and cities when conductive pipe is at it's minimum and pH is controlled - which is approximately 125 deaths per annum per 100,000 persons.
The "m" value is the ratio of approximately 5 divided by 2 from the same graph.
The second graph can then be used to shift the graphline according to the pH. The difference between the minimum increase in heart failure rates and the maximum is about 1.5. Our total pH range is 7.0 to 8.0 so a workable approximation can be the actual pH divided by the reference pH of 7.0, all squared. For example, a pH of 8.0 would give us 64 divided by 49 = 1.3; a close enough approximation.
So the starting graph is:
y = 2.5x + 125 [9]
and after referencing to pH it becomes:
y = (pH)2(2.5x + 125) all divided by 49 [10]
where y is the theoretical heart failure death rate
and x is the % of conductive pipe e.g. enter the value of 60 for 60%.
Outside the ranges of these graphs are some exceptions.
Wellington City has a heart failure rate 23% below the graph, and Taupo has a rate 28% below the graph.
The margins of error between theoretical and actual heart failure rates for other North Island towns not on the graphs are:
Auckland: 6%
Whangarei5%
Tauranga6%
At the time of writing, the percentage of conductive pipe in Rotorua is not available and the reticulation pH for Gisborne is not available.
The population data are for TLAs, so include those people not wholly on treated water. This would tend to make the theoretical rates slightly higher than the actual rates.
6. DISCUSSION
The results have a similarity to those of the Environmental Protection Agency as far as increased alkalinity relates to increased heart failure.
Napier and Hastings do not chlorinate while the rest of the graphed study group do. Napier and Hasting's proximity to the graphline suggests that there is no connection between chlorination or its byproducts per se and heart failure.
Wellington, to the contrary, chlorinates and then adjusts it's water pH but is some 23% below the graphline. Wellington receives the bulk of it's water from the Te Marua water treatment plant and the balance from treatment plants at Waterloo and Wainuiomata. The latter two are unchlorinated, which is no longer a factor, but have their pH adjusted using lime. The main Te Marua plant, however, adjusts pH using sodium hydroxide in which no hydronium ions are produced:
HCl + NaOH goes to NaCl + H2O [11]
If Wellington received water from Te Marua alone then it could be expected that the heart failure rate would be around 30% below the graph line. Water received from the other plants would offset this reduction, which is consistent with the actual rate being some 23% below the theoretical.
Taupo does not adjust it's pH at all. Water treatment is very simple with no addition of lime. Taupo's heart failure rate of 28% below the graph is very close to the expected theoretical reduction of approximately 30%.
p7
If the presence of hydronium in our drinking water is the basis of our epidemiology, we could then say that chlorine produces hydronium but it is the overall or total number of hydronium ions which matters regardless of the source. For instance, one town may add hydronium to it's reticulated water by adding chlorine while in another town the hydronium may already be in the raw water or added when the pH is adjusted using lime.
In the DHB graph it appeared that people living in larger cities had lower heart and cancer rates than those living in rural areas. The TLA graphs, however, suggest that this effect may be more specifically related to ions and/or their modification.
While the presence of hydronium ions may explain the elevated incidence of heart failure, it does not explain the chronological offset in the beginnings of the heart failure and cancer epidemics.
If we say that the start of the heart failure epidemic coincided with the introduction of water chlorination, then we need to account for the change that occurred around 1950 which coincided with the start of the cancer epidemic.
After 1950 it could be expected that some change occurred in the nature of hydronium ions whereby cholesterol could not adequately prevent cellular damage. Given the concurrent introduction of connecting water pipes to AC power, the most likely explanation would appear to be that there is some change made to those ions by water pipe ionisation.
Hydronium ions do not appear to adhere to the pipe wall of water pipe as iron and manganese do, but simply pass through.
One possibility may be that they accept an electron to form an hydronium radical. If so, this would explain the ability of the hydronium to flow through the water pipe. The radical form would have a neutral charge and behave as if negatively charged, and would be repelled from the pipe wall. The radical would also be far more damaging to cells because of it's ability to release an electron and, accordingly, cholesterol may be ineffective.
CONCLUSION
The conclusion drawn by the joint EPA and Oakridge study, that increased heart failure is related to chlorine byproducts and not to pH, is incorrect.
There are clear dose responses to lime adjusted pH and to water pipe ionisation.
Buffering is a viable alternative to pH adjustment, avoids ions resulting from excess alkalinity and supports the maintenance of life. Adjustment using sodium hydroxde may be a quick fix, with associated risks.
Isolation of AC power from water pipes and ground would remove the risk of water pipe ionisation. Replacement of conductive pipes with non conductive pipes, or equipotential bonding of pipes to transformer earths with associated risks, may be temporary fixes under current legislation.
A possible explanation for the effect of lime pH adjustment on heart failure rates is the production of hydronium. A possible explanation for the effect on cancer rates is the electrical conversion of hydronium to it's radical.
REFERENCES
1. Revis, N.W., McCauley, P., Bull, R., Holdsworth, G.(1986) Relationship of drinking water disinfectants to plasma cholesterol and thyroid hormone levels in experimental studies.
Proc. Natl. Acad. Sci. Vol. 83, pp. 1485-1489, March 1986, Medical Sciences. USA
2. Markovitch, O., Agmon, N. (2007) Structure and Energetics of the Hydronium Hydration Shells.
The Journal of Physical Chemistry, 2007, 111, 2253-2256. Published on Web 03/03/2007
p8
Rejected for 2009 ANZAScA Conference:
Comments, reviewer ID 119:
Although the conference theme is wide, lending itself to interdisciplinarity, I found the paper so far from architectural science that it would be hard recommending the paper for acceptances. The findings are certainly interesting, but it is difficult to see what the implications are for the design of spaces, and their associated scientific dimensions.
Comments reviewer ID 23:
Technical content/quality: low.
Originality: low.
Environment misspelled in title.
The paper is poorly referenced.
The paper is not relevant to ANZAScA themes in that it does not relate to building science or as is claimed, building health.
© Stephen G. Butcher