Wairarapa Health
- home page for cancer.net.nz, getting the basics right -
- home page for cancer.net.nz, getting the basics right -
Stephen
Butcher
email contact: wairarapa.health@yahoo.com
email contact: wairarapa.health@yahoo.com
Welcome.
There is a saying that "an apple a day keeps the doctor
away" and with that in mind I have arranged this page with
a view to setting out the things you can do for yourselves
to live well and reduce the work load on your doctor.
With the advent of COVID-19 I have updated my website: the two biggest killers of our time are and continue to be cancer and ischaemic heart failure, both caused by the practice of water chlorination, and each kill around 3000 persons per annum here in NZ. COVID-19 looks to have the potential to exceed both these epidemics.
COVID-19 is not just another flu. The death rate, at current estimation is around four fold that of the flu. The flu kills up to 900 persons per annum, so a four fold increase on that puts the potential death rate around 3600 persons per annum. These are best guesses, because it hasn't happened yet. But if it does, then the death rate will exceed both of our current epidemics. Our hospital system does not have the capacity to isolate or treat the possible number of victims.
COVID-19 is a SARS type virus and needs to be contained.
There is no cure for COVID-19. Treatment, in my opinion - and everyone is allowed an opinion, is to treat for subsequent bacterial infection to prevent a situation called "cascade" where a person does not die from the disease but from subsequent infection which runs wild. Vitamin C in the oxidised form of ascorbate which passes the blood/brain barrier would be an excellent contender as both preventative and therapeutic treatment. Traditional antibiotics may prove to have the opposite effect to that desired.
As preventative, anywhere between 1 gram and 5 grams per day of ascorbate, e.g. Ester C, would be useful.
As treatment, intravenous ascorbate is now a recognised treatment and available but you do need to ask for it (demand it!) as it will not normally be offered. Expect resistance from medical professionals but please feel free to exercise your human right to elect treatment options.
The medical journal, Lancet, has published a peer reviewed article on COVID-19 and I provide a link to this and a link to an article from Greece, not peer reviewed (but understandably so, given the urgency around containing COVID-19) which may be of interest, particularly to any doctors reading this who might think or are led to believe that the response to COVID-19 is a bit of an over-reaction.
Also as a preventative measure, in my opinion, when you or your nominated person re-enters your home after being out for essential supplies, your first task is TO WASH YOUR HANDS.
Also as a preventative measure, in my opinion, disinfect door knobs/paintwork daily.
Finally, I do think we are fortunate here in NZ to have Jacinda Ardern as Prime Minister rather than a stale and weary politician who might have been inclined to be defensive and play down the risk. We may not be told the full story of the genetic origins of COVID-19 but at least we do have the start of a matched response to the threat.
For those in Wairarapa, we seem to have community transmission, yet to be officially confirmed, which dates back to around Tuesday 17th March with possible contacts before then, so self-isolation of Wairarapa residents, Masterton and Carterton in particular, should now be a top priority until the case in confirmed, or not, officially.
Last updated 21 March 2020.
Update 7pm: there has been a confirmed case in Carterton, see this link. There has been no mention of affected schools but it is probable if the affected person has children of school age.
New update::
I have already been in self isolation for several days as we enter the official lock-down today.
The next 10 -11 days will likely see the current rate of increase continue, or a little higher after the panic buying of the last couple of days (WHY??), and then the decline in rate should start. It really does depend on how we absolutely have no contact with anyone at all outside our "bubble." From this point, hopefully, all future contacts can be traced.
To recap the mode of transmission of the SARS virus, it is aerosol (droplet) transmission, then contaminated surfaces (by droplet or contaminated contact) and lastly by faecal matter (nursing staff, plumbers, council staff working on sewers, i.e. in essential services).
The lifespan of the virus on a surface seems to be less than 5 days (updated), but faecal is unknown at this stage.
Also, the virus does not like heat: sunshine or a temperature above about 38 Celsius (updated) seems to be fatal for the virus.
The implication, then, is that as we exit summer we have a window of opportunity to beat the virus while the temperature is in our favour, which the northern hemisphere countries unfortunately did not.
We may also be fortunate enough to have restrictions lifted region by region or at least island by island as we break the chain of contact. Well done Northland.
Last updated 26 March.
There are now 5 cases of SARS-Cov-2 in Wairarapa where I live. I might be tempted to add a page and link for local residents if any information on those cases is released. Well done Greg Lang for making the first case public.
New update:
Well, a little old information. I have a link here to an old article copied from the South China Morning Post which outlines the method of attachment of the SARS-Cov-2 virus. My opinion is that this form of attachment suggests the virus to be altered, rather than having been adapted, for facilitating gene transfer for therapeutic purposes.
If this is so, then the virus out of the laboratory is under stress.
If this is so, the virus under stress will seek, as its default mode of transmission, the ecoli in which it was first propagated.
Genetic engineering uses Ecoli. Ecoli use circular pieces of DNA, "plasmids," into which can be inserted any desired DNA. This DNA is glued into place using an enzyme.
Using this hypothesis, surface contamination of door handles, loos at gatherings such as conferences and weddings, on board aircraft, etc could be the preferred mode of transmission where minute contamination with faecal matter on those surfaces maintains the life cycle of the SARS-Cov-2 virus.
As with any hypothesis, it remains valid until proven incorrect.
Last updated 27 March
New update:
The SARS-Cov-2 virus survives for different periods on surfaces. I have attached an article here which covers some of the conditions. Worst case is over 2 weeks survival in air conditioned indoor spaces compared to a maximum of 5 days in ventilated spaces. Hospital conditions tend to be the former.
That's me for this week.
A new week:
And now the waiting game, with the virus getting little speed wobbles - as it did when incidence took off.
Some doctors in China took HIV drugs. This is interesting. SARS-Cov-2 is an RNA virus so it has to go to DNA before it can produce more RNA of itself. A DNA virus can replicate, whereas the RNA virus must first transcribe to DNA.
Please excuse the poor explanation! - the DNA virus can be vaccinated against by using the protein coat that surrounds the virus, i.e. the coat only without the virus inside, so the immune system recognises the virus by its coat.
The RNA virus cannot be vaccinated against (so assurances that more money will bring a vaccine to market sooner might not be so compelling) but instead drugs are used which inhibit the enzymes employed in the conversion of RNA into DNA. So conventional treatment for SARS-Cov-2 is a cocktail of drugs to inhibit or target the various steps in the life cycle of the virus.
This may well explain why some Chinese doctors chose HIV drugs for their own treatment.
My point is that the best defence we have is not getting the virus in the first place, with continued isolation (distancing), tracing of contacts and testing being paramount.
We are still some days off a reduction in incidence. On reflection, our border processes were not up to the task earlier. That it not to lay blame, but to point to how we might improve border control and isolation processes in the future. When we do open our borders it will be to a world which has not beaten, and in my opinion will never beat, the virus.
Updated 31 March.
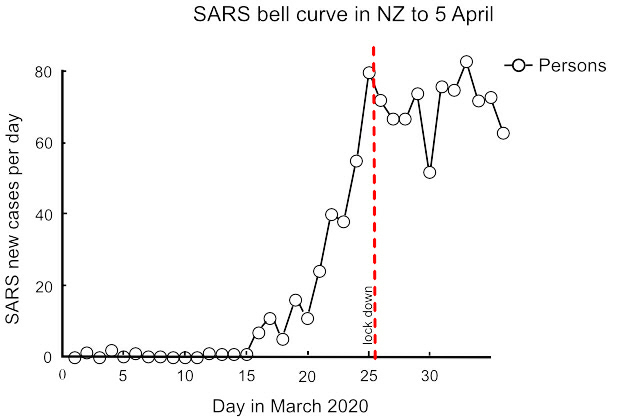
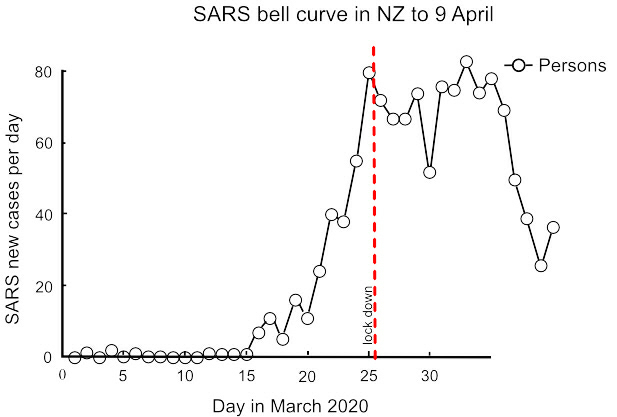
Today I have drawn a quick graph of daily new cases. We are not there yet as we have clusters and an unknown number of asymptomatic carriers. But this is looking good.
Updated 1 April.
New update:
I might just keep this graph going for a bit until there's a better way to home in on the bell curve. I've chosen the bell curve on the presumption that the virus might likely follow the pattern of start, exponential growth, until its food supply runs out, and then death. In which case the virus needs people, so keeping everyone away from the virus until its supply of people runs out is the key.
The graph for today is:
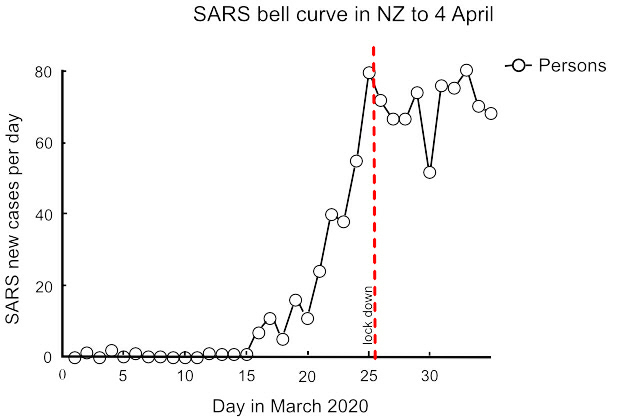
Here we can see the bell curve has been interrupted.
Rather than follow the bell shape, we are now heading to a
second peak. Possibly this may coincide with the
regrettable rush to stock up before lock-down (WHY??) and
could continue for another 2 - 3 days before declining
again. There are other possible reasons, such as increased
testing, repatriation, etc., but I will leave those aside
just for the moment.
Updated 2 April.
New update.
This addition is a tidy up. First is aerosol spread. Mainly this is droplet but for the sake of completeness I have added a paper here from Wuhan University, again not peer reviewed but understandable given time constraints, which gives some examples of potential aerosol spread outside the main avenue of droplet transmission. These examples are not primary transmission but if we are serious about leaving no stone unturned then we need to consider the application of this knowledge to the hospital context at least.
I have added a further bell graph and a graph of total cases. The total graph is not the graph of first choice: it is an assumption, a rush to state an answer without first asking the question. To arrive at the total graph we first must draw the bell graph and then, to logically arrive at the total graph, we must measure the area under the bell graph:
So the total graph looks like the pandemic is just getting worse - whereas the bell graph, in my opinion, gives a much clearer and more positive picture of where we are.
That's me for this week.

New update:
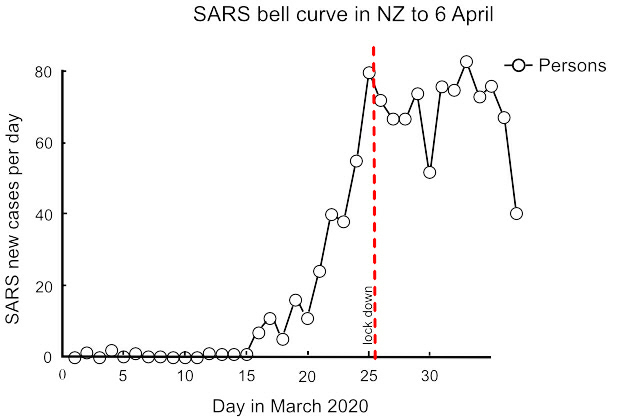
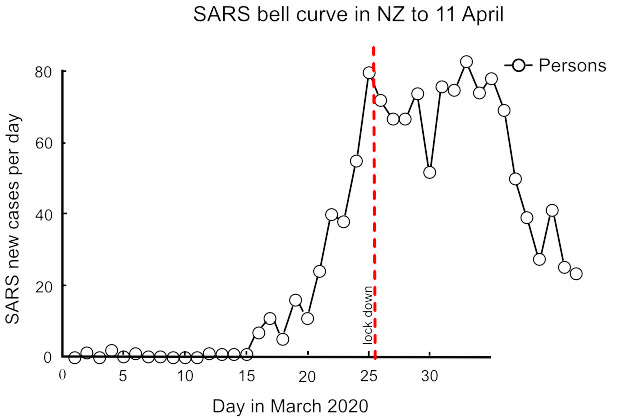
We seem to have passed the second peak, with the next phase largely depending on continued strict adherence of lock-down and avoidance of coming out of level 4 too early. Todays graph is:
The decline in daily cases likely will be irregular given the small sample size and the large effect of individual clusters.
The graphs are corrected from day to day as previous data are updated.
The length of the tail to the graph really does depend on everyone treating the risk of further outbreaks as a very serious concern, and taking every precaution to prevent them.
Updated 6 April.
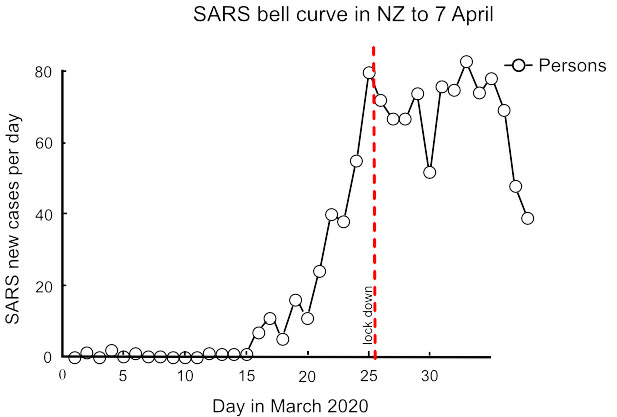
New update:
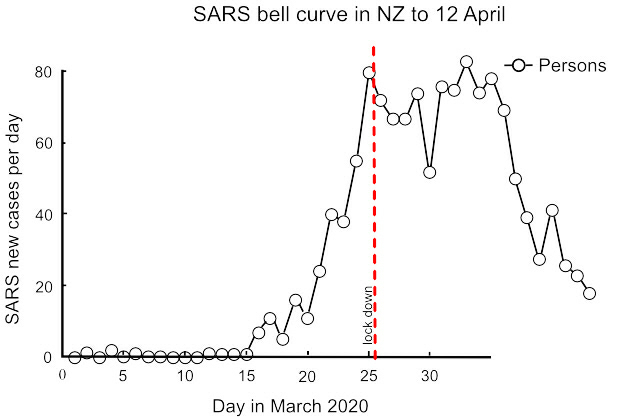
Another decline today. When repatriations occur they should be excluded from this graph as they should not inflate the current static population. If I am still graphing data when this becomes necessary, I will add the repatriation data as an overlay to the current data.
Updated 7 April.
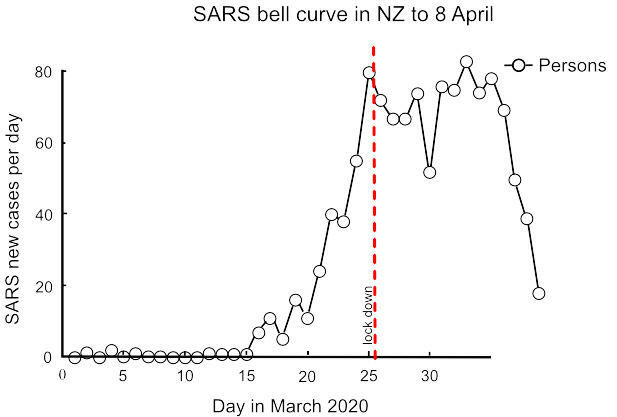
New update:
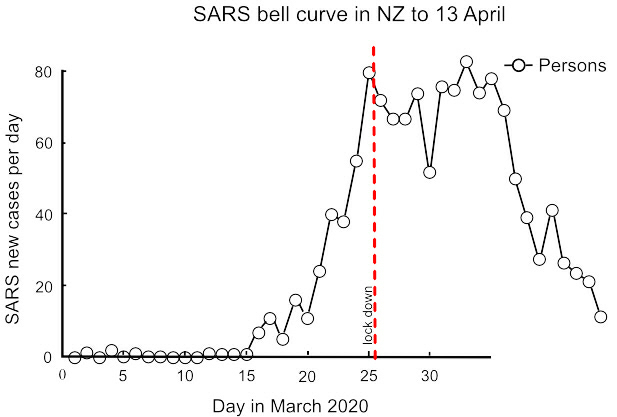
While still dropping, there is a catch. If
the growing cluster in Christchurch is dementia related,
this represents a significant challenge: an uncanny
ability of dementia sufferers to thwart containment of
themselves and the virus, as
if it is their god-ordained mission in life, should
not be under-estimated. Hopefully the hook in the graph is
not dementia related but, if it is, my opinion is that
physical containment with very
close 24 hour round-the-clock
supervision is needed. And disinfection. And ventilation.
And disinfection...Unfortunately I have learned the
dementia dichotomy the hard way, where appearances and
reality can be such polar opposites as to stretch
credibility.
I do not wish to deride anyone: I am just saying that dementia is a different ball game altogether to old age and the risks of subversive behaviour should not be under-estimated.
My penny's worth for 8 April.
New update:
I would like to argue that the SARS_CoV-2 virus is genetically modified, and this has an implication for the NZ economy.
Being an argument, I suggest deferred judgment should be exercised. Deferred judgement allows for greater opportunity for good ideas to come forward, even if as a result of apparently dubious arguments.
My argument, then, is that as a country we have a reputation for being nuclear free. The right wing among us will now be pointing to the costs of saving lives and my respectful counter to that is that we are now both nuclear free and, all being well, GE free. I consider that our trading position as a country having beaten SARS-CoV-2 puts us in a highly desirable trading position doing what we do best (even if we do call it "COVID Free NZ" rather than "GE Free NZ").
In my opinion the costs of lock-down are small compared to the gains in export reputation, the perceived quality of our products and our earnings. I know the motive for the lock down had nothing to do with financial gain or loss, and rightly so. I am just suggesting the doubters of such an approach do not have a convincing argument when it comes to the cost and we can now build on our approach to the way we do things.
Today's graph is a particularly moving one. I think it speaks for itself:
Updated 9 April.

New update:
I have been graphing disease incidence rather than deaths and will continue with that focus, but with respect to deaths there may be a related issue of virus mutation and its effect on a second wave of infection, either in the same persons or others, so I provide a link here to a peer reviewed article which touches on that subject.
Updated 14 April.
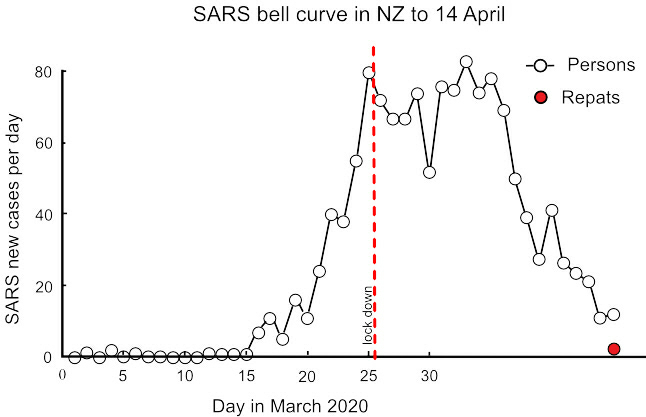
Updated 15 April.
New update:
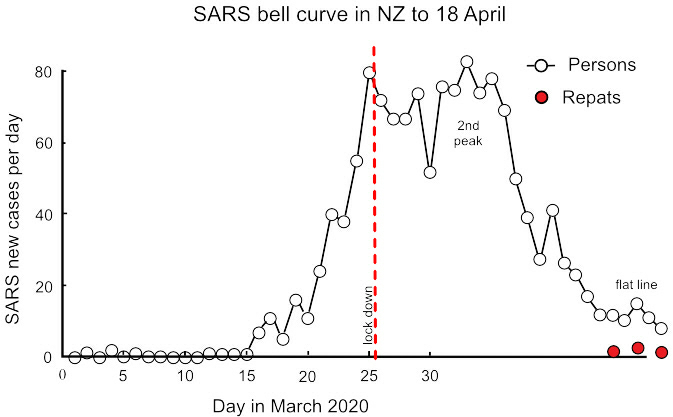
Repatriated cases are now separated out. As these data are not clearly separated at first iteration, corrections will appear as the data are available. At this stage, the danger is in a flat tail (where the graph becomes a horizontal line).
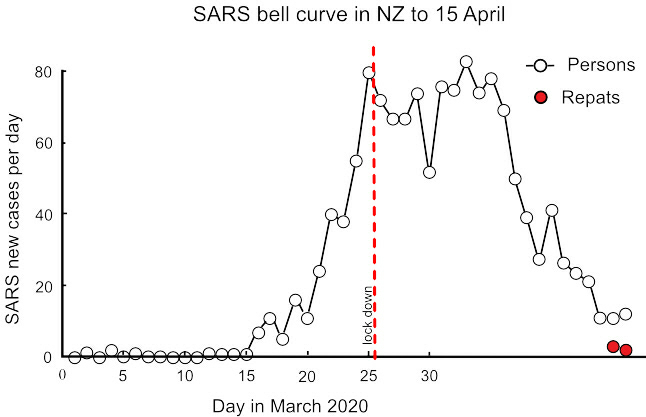
Updated 16 April.
New update:
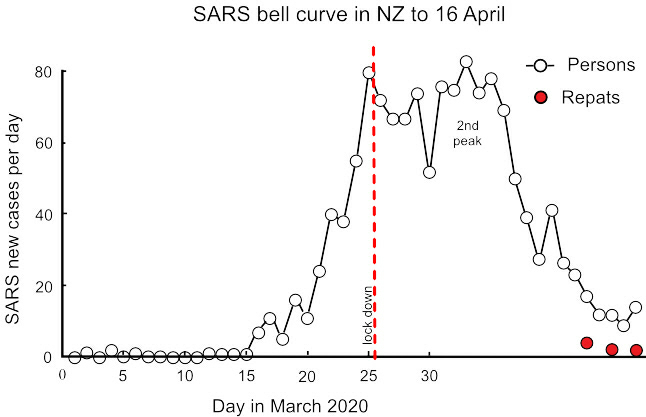
Updated 17 April.
New update:
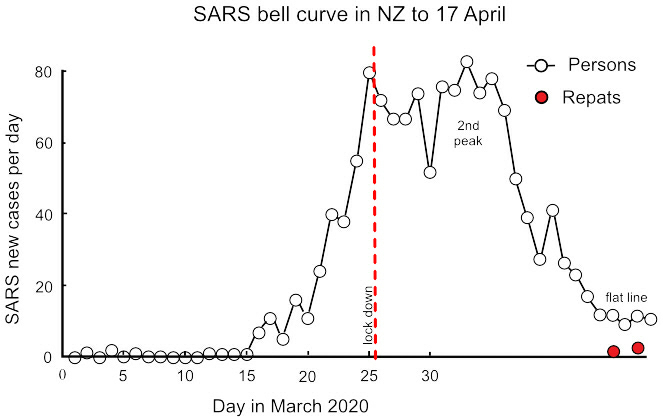
Here I have provisionally labelled the last 5 days as a flat line.There appears to be absolutely no room for a change to level 3. .
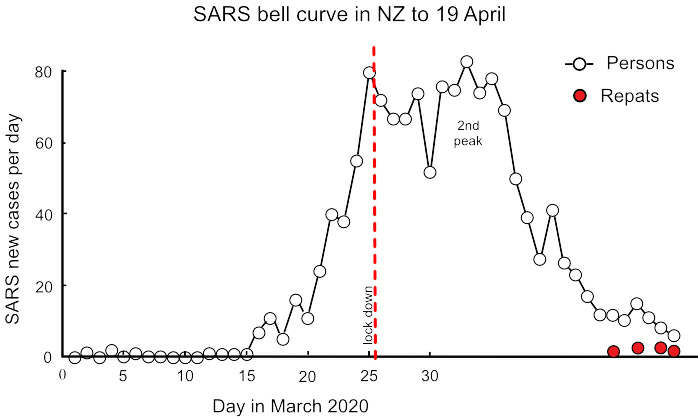
Updated 18 April.
New update: The data today are inconsistent. Today's cases can be either 8, 9 or 12 depending on which data are referred to. Therefore these data are unreliable for any decision on level 3. I have graphed for 8 cases but I doubt this is correct - a higher incidence is likely.
Updated 19 April.
New update: Updated data confirm 8 as the correct figure for 19 April. I have removed the reference to the flat line tail as today's data confirm a downward tail, and eradication as the probable outcome.
Water::
My previous web page now continues. Wouldn't it make sense to take the cancer and heart failure epidemics as seriously as SARS-CoV-2? We could beat them both in 12 months if the political will was there.
The sole cause of the cancer and heart failure epidemics is chlorinated water.
The best thing you can do for your health is to drink water which has not been chlorinated.
Living in a town or city does make this difficult. There are springs around so search them out. most towns and cities formed around spring fed water supplies so they are there, or you may have to go further afield to a farm.
Drinking water is not the only issue. Showering or bathing should also avoid chlorinated water because of absorption through the skin and inhalation.
If you are on a chlorinated water supply then this is going to be difficult. You could drill your own water bore of course. If that is too difficult initially then filtration might at least reduce the risks at minimal cost and inconvenience until you can get of the town supply completely.
Filtration requires three stages. The first is a pre-filter to get rid of the muck in town water which would clog up the second and third filters. This first filter should be 1 micron, which works out to be 1 -3 microns in practice.The second filter should be activated carbon for "chlorine removal." It actually doesn't remove chlorine - it changes the chlorine into an ion. The third filter should be a de-ionising filter to take out the chlorine after it has been converted into an ion.
The following is my promotional material for the last DHB election. I was lowest polling of all the candidates - but I will keep this online for a while yet:
Aims of the Wairarapa DHB:
The aim of our DHB is: "Our performance is measured against national health targets...(which) provide a focus for action and are reviewed annually to ensure they align with government health priorities.
There are six national health targets:
1. Shorter stays in Emergency Departments
2. Improved access to elective surgery
3. Shorter waits for cancer treatment
4. Increased immunisation
5. Better help for smokers to quit
6. Raising healthy kids."
An effective goal might consist of "Aim" (what health improvement are we seeking?), then "Method" (how might we achieve this, which can be by multiple means?) and then "Review" (are we achieving the desired health improvement?).
The budget of our DHB is around $153 million per annum. This does relate to aim, we just need some numbers first:
The $153m breaks down, roughly, to:
- Admin $4m
- Hospital $61m
- Aged care $26m
- Drugs $12m
- Capitation $11m (subsides to "cap" fees, etc)
- Mental health $4m
- IDF outflows $40m (see below)
Leaving aside my desire to see the books, the big discrepancy is the "IDF outflow" - which stands for "Inter-District Flow."
Put another way, the elephant in the room is the enormous cost of sending cancer patients to other hospitals for treatment. If this wasn't so high, we usefully could do a great deal better in terms of supporting staff and providing a better service, all within budget.
The goals or aims, as guidance from the Ministry, don't address this issue. If we look at (3) above, "shorter waits for cancer treatments," it is apparent that this is a Method. We might guess the Aim is improved survival rates after treatment. If we look at (5) above, "better help for smokers to quit," again this is a Method if we presume the goal to be preventing lung cancer.
So goal (1) and goal (5) are aspects of the same unstated Aim of less cancer victims.
If we reduce the number of smokers, lung cancer will not go down proportionately. Benzo-a-pyrene from cigarette smoking attaches to DNA to form mutations because the DNA is oxidised. In the absence of benzo-a-pyrene, another carcinogen will fill the same role. It is just that benzo-a-pyrene preferentially attaches to DNA because it loses the most amount of energy in the attachment process.
Too much information?
It means most cancers are caused by oxidation of DNA from our faulty drinking water treatment processes.
If our Aim was to cut cancer admissions in half, and not spend, say, $20m on IDF outflows, then we would need to alter water treatment processes. That would be a seriously uphill battle, but an achievable first step would be to reduce the alkalinity of drinking water in our Wairarapa towns. For example, a change of 0.3 on the pH scale is proportional to a halving in cancer incidence (the pH scale is logrithmic).
Not sure (eyes rolling)? The incidence of cancer in Masterton is 4 times that of Wellington. It is 9 times higher than it was in 1968 before the chlorinator was installed.
Halving cancer rates isn't an impossible dream, it is the bare minimum we should expect to do. So my point is that the elephant has to be acknowledged - and our aim has to be to get cancer rates down and ultimately this means going to the LT2 Standard.
I invite you to read further, if you wish, from the following peer reviewed articles.
Scholarly Articles:
Yang et al. This paper is brilliant for the size of the sampling and control of confounders. It clearly demonstrates what we already know, which is that chlorination doubles the incidence of cancers, on average (that large sample). So our 9 fold increase puts us to shame.
EPA on chlorination. This copy is from the Federal Register and sets out the confirmed side effects of outdated chlorination processes.
Cameron and Pauling. One of my favourite articles. These two rather clever people (well, Pauling has a Nobel Prize) took terminal untreatable cancer patients and achieved very good results. I think they might know something about oxidation!
This is only a brief list, so on to mental health:
Eby et al. Small study, but outstanding results. This suggests a trial of magnesium glycinate as supportive therapy should be a high priority. Of note is the comment that drinking water treatments strip magnesium out of water supplies, suggesting that high cancer rates and high rates of depression go hand in hand.
Rubenowitz et al. The counter opinion that alkalinity and magnesium protect against heart disease, but tactfully concludes that the effect is really due to magnesium alone (to avoid criticism from commercial interests, probably, such as the Chlorine Chemistry Council).
And to air pollution.
Ministry of Health. Research contracted out, Massey University mainly. Tested for Persistent Organic Pollutants (POPs) such as polychlorinated biphenols, dioxins and furans in mothers' milk. Insecticides are sources (decreasingly), as well as burning rubbish (increasingly). An example would be burning waste on a farm and mum drinking water from roof water collection, and smoke drift from towns entering the food chain via contaminated pasture. These POPs are passed on to baby with resultant developmental problems.
So, the Aim is?
In this election there is an opportunity for a clean sweep. The current model of goverance has done remarkably well considering just how overloaded our DHB has become - but it cannot continue, in my opinion, without earning the frustration of the Minister who expects fiscal responsibility and governance with vision.
Addition:
One difference in cancer incidence and ischaemic heart failure can be seen by comparing water supplies which adjust pH using lime to those which buffer the pH. Research on carneau pigeons illustrates the effect:
The first study, here, uses lime to adjust water pH in line with the vast majority of water supplies. The second article, here, uses a bicarbonate buffer instead of lime with the result that the detrimental effects in the first study are not found in the second. The second study was commissioned to refute the first but inadvertently confirmed that adjustment rather than buffering, all other factors controlled, was responsible for the formation of excess plasma cholesterol and reduced thyroxine T4. In real life terms this equates to a 30% reduction in both cancer and heart failure rates simply by using sodium hydroxide rather than lime to control acidity in water supplies.
When it comes to the nuts and bolts, sodium hydroxide can be put through equipment which doses with lime but not vice versa, i.e. hydroxide can go through existing equipment. Also, the cost of lime and sodium hydroxide are pretty much the same.
So, for a little effort and almost no expense, cancer and heart failure rates could come down by 30% in the year following a change to buffering, and stay down. Worthwhile, surely.
It just needs to get past the "you and whose army" reflex.
Together we can do it.
My latest post
The Government has, quite rightly I believe, identified cancer and mental health as two areas which need action. I am most encouraged by this acknowledgement and, like a great many others, I am sure I am not alone in being affected one way or another.
I think it would be easy, instead, to slide into fine tuning or re-prioritising treatment options to attempt to balance the books rather than take on the necessary improvements. An example might be, if a person is diagnosed with cancer then, rather than jumping to surgery or chemotherapy, treatment might involve stabilising the tumour or slowing its growth so that in practical terms the cancer has no adverse effect on a person's quality of life - and they pass away in their allotted time of old age before the cancer advances sufficiently to be a problem. This saves a little on costs and improves our patient's quality of life.
That is arguably a more clever way of treatment than the current slash and burn approach, but on its own the effect on our health care system is negligible. The real improvements come when our cancer patient doesn't get cancer in the first place.
So I maintain that our focus has to be prevention - and, yes, we can be clever with better treatments in addition to prevention.
With the advent of COVID-19 I have updated my website: the two biggest killers of our time are and continue to be cancer and ischaemic heart failure, both caused by the practice of water chlorination, and each kill around 3000 persons per annum here in NZ. COVID-19 looks to have the potential to exceed both these epidemics.
COVID-19 is not just another flu. The death rate, at current estimation is around four fold that of the flu. The flu kills up to 900 persons per annum, so a four fold increase on that puts the potential death rate around 3600 persons per annum. These are best guesses, because it hasn't happened yet. But if it does, then the death rate will exceed both of our current epidemics. Our hospital system does not have the capacity to isolate or treat the possible number of victims.
COVID-19 is a SARS type virus and needs to be contained.
There is no cure for COVID-19. Treatment, in my opinion - and everyone is allowed an opinion, is to treat for subsequent bacterial infection to prevent a situation called "cascade" where a person does not die from the disease but from subsequent infection which runs wild. Vitamin C in the oxidised form of ascorbate which passes the blood/brain barrier would be an excellent contender as both preventative and therapeutic treatment. Traditional antibiotics may prove to have the opposite effect to that desired.
As preventative, anywhere between 1 gram and 5 grams per day of ascorbate, e.g. Ester C, would be useful.
As treatment, intravenous ascorbate is now a recognised treatment and available but you do need to ask for it (demand it!) as it will not normally be offered. Expect resistance from medical professionals but please feel free to exercise your human right to elect treatment options.
The medical journal, Lancet, has published a peer reviewed article on COVID-19 and I provide a link to this and a link to an article from Greece, not peer reviewed (but understandably so, given the urgency around containing COVID-19) which may be of interest, particularly to any doctors reading this who might think or are led to believe that the response to COVID-19 is a bit of an over-reaction.
Also as a preventative measure, in my opinion, when you or your nominated person re-enters your home after being out for essential supplies, your first task is TO WASH YOUR HANDS.
Also as a preventative measure, in my opinion, disinfect door knobs/paintwork daily.
Finally, I do think we are fortunate here in NZ to have Jacinda Ardern as Prime Minister rather than a stale and weary politician who might have been inclined to be defensive and play down the risk. We may not be told the full story of the genetic origins of COVID-19 but at least we do have the start of a matched response to the threat.
For those in Wairarapa, we seem to have community transmission, yet to be officially confirmed, which dates back to around Tuesday 17th March with possible contacts before then, so self-isolation of Wairarapa residents, Masterton and Carterton in particular, should now be a top priority until the case in confirmed, or not, officially.
Last updated 21 March 2020.
Update 7pm: there has been a confirmed case in Carterton, see this link. There has been no mention of affected schools but it is probable if the affected person has children of school age.
New update::
I have already been in self isolation for several days as we enter the official lock-down today.
The next 10 -11 days will likely see the current rate of increase continue, or a little higher after the panic buying of the last couple of days (WHY??), and then the decline in rate should start. It really does depend on how we absolutely have no contact with anyone at all outside our "bubble." From this point, hopefully, all future contacts can be traced.
To recap the mode of transmission of the SARS virus, it is aerosol (droplet) transmission, then contaminated surfaces (by droplet or contaminated contact) and lastly by faecal matter (nursing staff, plumbers, council staff working on sewers, i.e. in essential services).
The lifespan of the virus on a surface seems to be less than 5 days (updated), but faecal is unknown at this stage.
Also, the virus does not like heat: sunshine or a temperature above about 38 Celsius (updated) seems to be fatal for the virus.
The implication, then, is that as we exit summer we have a window of opportunity to beat the virus while the temperature is in our favour, which the northern hemisphere countries unfortunately did not.
We may also be fortunate enough to have restrictions lifted region by region or at least island by island as we break the chain of contact. Well done Northland.
Last updated 26 March.
There are now 5 cases of SARS-Cov-2 in Wairarapa where I live. I might be tempted to add a page and link for local residents if any information on those cases is released. Well done Greg Lang for making the first case public.
New update:
Well, a little old information. I have a link here to an old article copied from the South China Morning Post which outlines the method of attachment of the SARS-Cov-2 virus. My opinion is that this form of attachment suggests the virus to be altered, rather than having been adapted, for facilitating gene transfer for therapeutic purposes.
If this is so, then the virus out of the laboratory is under stress.
If this is so, the virus under stress will seek, as its default mode of transmission, the ecoli in which it was first propagated.
Genetic engineering uses Ecoli. Ecoli use circular pieces of DNA, "plasmids," into which can be inserted any desired DNA. This DNA is glued into place using an enzyme.
Using this hypothesis, surface contamination of door handles, loos at gatherings such as conferences and weddings, on board aircraft, etc could be the preferred mode of transmission where minute contamination with faecal matter on those surfaces maintains the life cycle of the SARS-Cov-2 virus.
As with any hypothesis, it remains valid until proven incorrect.
Last updated 27 March
New update:
The SARS-Cov-2 virus survives for different periods on surfaces. I have attached an article here which covers some of the conditions. Worst case is over 2 weeks survival in air conditioned indoor spaces compared to a maximum of 5 days in ventilated spaces. Hospital conditions tend to be the former.
That's me for this week.
A new week:
And now the waiting game, with the virus getting little speed wobbles - as it did when incidence took off.
Some doctors in China took HIV drugs. This is interesting. SARS-Cov-2 is an RNA virus so it has to go to DNA before it can produce more RNA of itself. A DNA virus can replicate, whereas the RNA virus must first transcribe to DNA.
Please excuse the poor explanation! - the DNA virus can be vaccinated against by using the protein coat that surrounds the virus, i.e. the coat only without the virus inside, so the immune system recognises the virus by its coat.
The RNA virus cannot be vaccinated against (so assurances that more money will bring a vaccine to market sooner might not be so compelling) but instead drugs are used which inhibit the enzymes employed in the conversion of RNA into DNA. So conventional treatment for SARS-Cov-2 is a cocktail of drugs to inhibit or target the various steps in the life cycle of the virus.
This may well explain why some Chinese doctors chose HIV drugs for their own treatment.
My point is that the best defence we have is not getting the virus in the first place, with continued isolation (distancing), tracing of contacts and testing being paramount.
We are still some days off a reduction in incidence. On reflection, our border processes were not up to the task earlier. That it not to lay blame, but to point to how we might improve border control and isolation processes in the future. When we do open our borders it will be to a world which has not beaten, and in my opinion will never beat, the virus.
Updated 31 March.
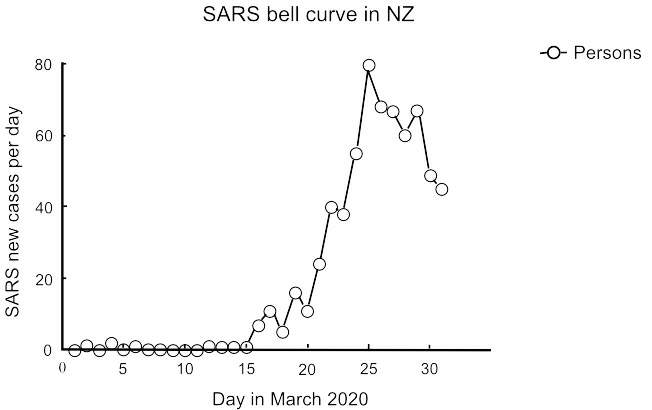
Today I have drawn a quick graph of daily new cases. We are not there yet as we have clusters and an unknown number of asymptomatic carriers. But this is looking good.
Updated 1 April.
New update:
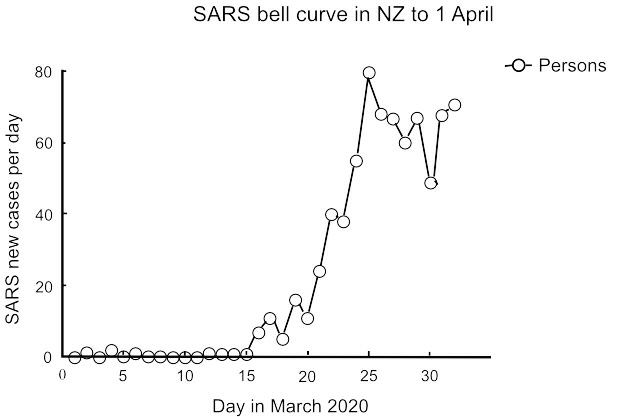
I might just keep this graph going for a bit until there's a better way to home in on the bell curve. I've chosen the bell curve on the presumption that the virus might likely follow the pattern of start, exponential growth, until its food supply runs out, and then death. In which case the virus needs people, so keeping everyone away from the virus until its supply of people runs out is the key.
The graph for today is:
Updated 2 April.
New update.
This addition is a tidy up. First is aerosol spread. Mainly this is droplet but for the sake of completeness I have added a paper here from Wuhan University, again not peer reviewed but understandable given time constraints, which gives some examples of potential aerosol spread outside the main avenue of droplet transmission. These examples are not primary transmission but if we are serious about leaving no stone unturned then we need to consider the application of this knowledge to the hospital context at least.
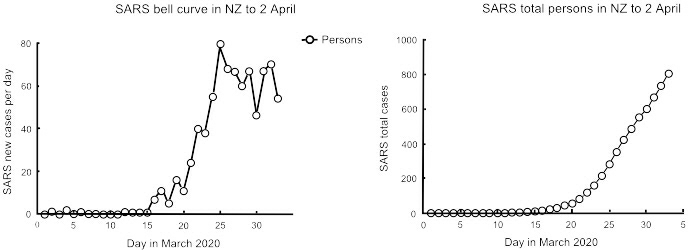
I have added a further bell graph and a graph of total cases. The total graph is not the graph of first choice: it is an assumption, a rush to state an answer without first asking the question. To arrive at the total graph we first must draw the bell graph and then, to logically arrive at the total graph, we must measure the area under the bell graph:
So the total graph looks like the pandemic is just getting worse - whereas the bell graph, in my opinion, gives a much clearer and more positive picture of where we are.
That's me for this week.
We seem to have passed the second peak, with the next phase largely depending on continued strict adherence of lock-down and avoidance of coming out of level 4 too early. Todays graph is:
The decline in daily cases likely will be irregular given the small sample size and the large effect of individual clusters.
The graphs are corrected from day to day as previous data are updated.
The length of the tail to the graph really does depend on everyone treating the risk of further outbreaks as a very serious concern, and taking every precaution to prevent them.
Updated 6 April.
New update:
Another decline today. When repatriations occur they should be excluded from this graph as they should not inflate the current static population. If I am still graphing data when this becomes necessary, I will add the repatriation data as an overlay to the current data.
New update:
I do not wish to deride anyone: I am just saying that dementia is a different ball game altogether to old age and the risks of subversive behaviour should not be under-estimated.
My penny's worth for 8 April.
New update:
I would like to argue that the SARS_CoV-2 virus is genetically modified, and this has an implication for the NZ economy.
Being an argument, I suggest deferred judgment should be exercised. Deferred judgement allows for greater opportunity for good ideas to come forward, even if as a result of apparently dubious arguments.
My argument, then, is that as a country we have a reputation for being nuclear free. The right wing among us will now be pointing to the costs of saving lives and my respectful counter to that is that we are now both nuclear free and, all being well, GE free. I consider that our trading position as a country having beaten SARS-CoV-2 puts us in a highly desirable trading position doing what we do best (even if we do call it "COVID Free NZ" rather than "GE Free NZ").
In my opinion the costs of lock-down are small compared to the gains in export reputation, the perceived quality of our products and our earnings. I know the motive for the lock down had nothing to do with financial gain or loss, and rightly so. I am just suggesting the doubters of such an approach do not have a convincing argument when it comes to the cost and we can now build on our approach to the way we do things.
Today's graph is a particularly moving one. I think it speaks for itself:
New update:
I have been graphing disease incidence rather than deaths and will continue with that focus, but with respect to deaths there may be a related issue of virus mutation and its effect on a second wave of infection, either in the same persons or others, so I provide a link here to a peer reviewed article which touches on that subject.
Updated 14 April.
Updated 15 April.
New update:
Repatriated cases are now separated out. As these data are not clearly separated at first iteration, corrections will appear as the data are available. At this stage, the danger is in a flat tail (where the graph becomes a horizontal line).
Updated 16 April.
New update:
Updated 17 April.
New update:
Here I have provisionally labelled the last 5 days as a flat line.There appears to be absolutely no room for a change to level 3. .
Updated 18 April.
New update: The data today are inconsistent. Today's cases can be either 8, 9 or 12 depending on which data are referred to. Therefore these data are unreliable for any decision on level 3. I have graphed for 8 cases but I doubt this is correct - a higher incidence is likely.
Updated 19 April.
New update: Updated data confirm 8 as the correct figure for 19 April. I have removed the reference to the flat line tail as today's data confirm a downward tail, and eradication as the probable outcome.
Updated 20 April.
On reflection:
On reflection, and again this is my opinion, as our bell curve is very short and the rest of the world will have a very long bell curve, the danger to our economy is not in the short term, where a cash injection (by printing money) will give it a kick start, but in the longer term where our currency falls victim to the financial woes of a world economy under prolonged stress.
The position of the tourist industry is pertinent. Our tourist operators charged for their services to the maximum tourists could stand to pay, which was more than the local market could pay. So when tourists stopped coming, their businesses stopped selling. Had they looked after the local market first, they would have had resilience when Covid-19 struck.
Similarly, the United States, during WWII, had resilience because they geared up to meet both local demand and the war effort.
We are now in a war economy. If we stay as a floating currency, we will go down with the global economy if it comes to that.
My opinion is that we should look to fix our currency to renewable kilowatts, and add value to exports to meet the needs of the local market.
By tying to renewable kW, we tie the value of the Kiwi to something intrinsic to New Zealand and which will hold its value.
Adding value to exports, in my opinion, should be to lower our standard of living. My argument is that the added value should aim to process a significant portion of our current exports into product which is sold on the New Zealand market, both to reduce exports and replace some current imports.
For example, we export wool. We import materials for synthetic carpet. So - we produce more wool carpet to sell in the local economy which means we are less reliant on imports and more resilient should the global demand for wool collapse due to failed economies under the effect of Covid-19.
This lowers our standard of living because we are producing our own goods rather than buying cheaper goods which have been produced more efficiently elsewhere.
In my opinion, the challenge now is to invest in added value product for the local market:- to look after the local economy so that a significant part of our exporters' income is derived from local sales, to make our economy more resilient in the face of a likely severe global downturn.
This is a digression from health but perhaps not unrelated.
Updated 24 April.
New update:
A small observation on the tail of the bell curve - is there a 5 day cycle? I put it as a question.
Also, it is rare to read predictive material which rings true. But I suggest this article by Daniel Araya is one of those very rare insights.
My apologies for not properly quoting the source. It may have been Forbes.
Updated 13 May.
Our cancer and heart failure epidemics can be shut down.
Unlike the SARS-2 pandemic, there would be no upheaval of daily life, no national emergency and no risk of further outbreaks.
The big difference between SARS-2 and the epidemics of cancer and heart failure is that these latter epidemics are not transmissible diseases. Once turned off, they cannot continue to threaten public health.
Their great similarity is they all predominantly target the elderly, as fatalities in particular. This "justifies" the prevailing philosophy which says, in effect, that we can live with these epidemics because the elderly were going to die anyway - and a few years sooner is neither here nor there.
This dismissal of human tragedy has a backlash in two ways.
First, we all get older so nobody is immune from the consequences of this kind of laissez-faire justification for maintaining chlorination and, secondly, the epidemics creep forward affecting not just the elderly but, increasingly, those in middle age or younger. For cancer and heart failure, the age at which a person might be affected becomes earlier because initially, when chlorination was first introduced, the elderly were particularly affected while younger age groups had not been exposed for any length of time. As the years have passed, people have become exposed for longer and are now exposed from birth.
The same is likely to occur with SARS-2. As the world fails to control the pandemic, the "initial kill" of elderly will progress to "less elderly" as people suffer not just their first infection but subsequent infections with SARS-2.
The cancer and heart failure epidemics are not universal - some countries have neither. These epidemics are presentations of an underlying process of oxidation and reduction gone wrong. We chemically dose our water supplies where we should be using point-of-use (POU) filtration.
On reflection:
On reflection, and again this is my opinion, as our bell curve is very short and the rest of the world will have a very long bell curve, the danger to our economy is not in the short term, where a cash injection (by printing money) will give it a kick start, but in the longer term where our currency falls victim to the financial woes of a world economy under prolonged stress.
The position of the tourist industry is pertinent. Our tourist operators charged for their services to the maximum tourists could stand to pay, which was more than the local market could pay. So when tourists stopped coming, their businesses stopped selling. Had they looked after the local market first, they would have had resilience when Covid-19 struck.
Similarly, the United States, during WWII, had resilience because they geared up to meet both local demand and the war effort.
We are now in a war economy. If we stay as a floating currency, we will go down with the global economy if it comes to that.
My opinion is that we should look to fix our currency to renewable kilowatts, and add value to exports to meet the needs of the local market.
By tying to renewable kW, we tie the value of the Kiwi to something intrinsic to New Zealand and which will hold its value.
Adding value to exports, in my opinion, should be to lower our standard of living. My argument is that the added value should aim to process a significant portion of our current exports into product which is sold on the New Zealand market, both to reduce exports and replace some current imports.
For example, we export wool. We import materials for synthetic carpet. So - we produce more wool carpet to sell in the local economy which means we are less reliant on imports and more resilient should the global demand for wool collapse due to failed economies under the effect of Covid-19.
This lowers our standard of living because we are producing our own goods rather than buying cheaper goods which have been produced more efficiently elsewhere.
In my opinion, the challenge now is to invest in added value product for the local market:- to look after the local economy so that a significant part of our exporters' income is derived from local sales, to make our economy more resilient in the face of a likely severe global downturn.
This is a digression from health but perhaps not unrelated.
Updated 24 April.
New update:
A small observation on the tail of the bell curve - is there a 5 day cycle? I put it as a question.
Also, it is rare to read predictive material which rings true. But I suggest this article by Daniel Araya is one of those very rare insights.
My apologies for not properly quoting the source. It may have been Forbes.
Updated 13 May.
New
Zealand's Cancer and Heart Failure Epidemics
Our cancer and heart failure epidemics can be shut down.
Unlike the SARS-2 pandemic, there would be no upheaval of daily life, no national emergency and no risk of further outbreaks.
The big difference between SARS-2 and the epidemics of cancer and heart failure is that these latter epidemics are not transmissible diseases. Once turned off, they cannot continue to threaten public health.
Their great similarity is they all predominantly target the elderly, as fatalities in particular. This "justifies" the prevailing philosophy which says, in effect, that we can live with these epidemics because the elderly were going to die anyway - and a few years sooner is neither here nor there.
This dismissal of human tragedy has a backlash in two ways.
First, we all get older so nobody is immune from the consequences of this kind of laissez-faire justification for maintaining chlorination and, secondly, the epidemics creep forward affecting not just the elderly but, increasingly, those in middle age or younger. For cancer and heart failure, the age at which a person might be affected becomes earlier because initially, when chlorination was first introduced, the elderly were particularly affected while younger age groups had not been exposed for any length of time. As the years have passed, people have become exposed for longer and are now exposed from birth.
The same is likely to occur with SARS-2. As the world fails to control the pandemic, the "initial kill" of elderly will progress to "less elderly" as people suffer not just their first infection but subsequent infections with SARS-2.
The cancer and heart failure epidemics are not universal - some countries have neither. These epidemics are presentations of an underlying process of oxidation and reduction gone wrong. We chemically dose our water supplies where we should be using point-of-use (POU) filtration.
Water::
My previous web page now continues. Wouldn't it make sense to take the cancer and heart failure epidemics as seriously as SARS-CoV-2? We could beat them both in 12 months if the political will was there.
The sole cause of the cancer and heart failure epidemics is chlorinated water.
The best thing you can do for your health is to drink water which has not been chlorinated.
Living in a town or city does make this difficult. There are springs around so search them out. most towns and cities formed around spring fed water supplies so they are there, or you may have to go further afield to a farm.
Drinking water is not the only issue. Showering or bathing should also avoid chlorinated water because of absorption through the skin and inhalation.
If you are on a chlorinated water supply then this is going to be difficult. You could drill your own water bore of course. If that is too difficult initially then filtration might at least reduce the risks at minimal cost and inconvenience until you can get of the town supply completely.
Filtration requires three stages. The first is a pre-filter to get rid of the muck in town water which would clog up the second and third filters. This first filter should be 1 micron, which works out to be 1 -3 microns in practice.The second filter should be activated carbon for "chlorine removal." It actually doesn't remove chlorine - it changes the chlorine into an ion. The third filter should be a de-ionising filter to take out the chlorine after it has been converted into an ion.
The following is my promotional material for the last DHB election. I was lowest polling of all the candidates - but I will keep this online for a while yet:
Aims of the Wairarapa DHB:
The aim of our DHB is: "Our performance is measured against national health targets...(which) provide a focus for action and are reviewed annually to ensure they align with government health priorities.
There are six national health targets:
1. Shorter stays in Emergency Departments
2. Improved access to elective surgery
3. Shorter waits for cancer treatment
4. Increased immunisation
5. Better help for smokers to quit
6. Raising healthy kids."
An effective goal might consist of "Aim" (what health improvement are we seeking?), then "Method" (how might we achieve this, which can be by multiple means?) and then "Review" (are we achieving the desired health improvement?).
The budget of our DHB is around $153 million per annum. This does relate to aim, we just need some numbers first:
The $153m breaks down, roughly, to:
- Admin $4m
- Hospital $61m
- Aged care $26m
- Drugs $12m
- Capitation $11m (subsides to "cap" fees, etc)
- Mental health $4m
- IDF outflows $40m (see below)
Leaving aside my desire to see the books, the big discrepancy is the "IDF outflow" - which stands for "Inter-District Flow."
Put another way, the elephant in the room is the enormous cost of sending cancer patients to other hospitals for treatment. If this wasn't so high, we usefully could do a great deal better in terms of supporting staff and providing a better service, all within budget.
The goals or aims, as guidance from the Ministry, don't address this issue. If we look at (3) above, "shorter waits for cancer treatments," it is apparent that this is a Method. We might guess the Aim is improved survival rates after treatment. If we look at (5) above, "better help for smokers to quit," again this is a Method if we presume the goal to be preventing lung cancer.
So goal (1) and goal (5) are aspects of the same unstated Aim of less cancer victims.
If we reduce the number of smokers, lung cancer will not go down proportionately. Benzo-a-pyrene from cigarette smoking attaches to DNA to form mutations because the DNA is oxidised. In the absence of benzo-a-pyrene, another carcinogen will fill the same role. It is just that benzo-a-pyrene preferentially attaches to DNA because it loses the most amount of energy in the attachment process.
Too much information?
It means most cancers are caused by oxidation of DNA from our faulty drinking water treatment processes.
If our Aim was to cut cancer admissions in half, and not spend, say, $20m on IDF outflows, then we would need to alter water treatment processes. That would be a seriously uphill battle, but an achievable first step would be to reduce the alkalinity of drinking water in our Wairarapa towns. For example, a change of 0.3 on the pH scale is proportional to a halving in cancer incidence (the pH scale is logrithmic).
Not sure (eyes rolling)? The incidence of cancer in Masterton is 4 times that of Wellington. It is 9 times higher than it was in 1968 before the chlorinator was installed.
Halving cancer rates isn't an impossible dream, it is the bare minimum we should expect to do. So my point is that the elephant has to be acknowledged - and our aim has to be to get cancer rates down and ultimately this means going to the LT2 Standard.
I invite you to read further, if you wish, from the following peer reviewed articles.
Scholarly Articles:
Yang et al. This paper is brilliant for the size of the sampling and control of confounders. It clearly demonstrates what we already know, which is that chlorination doubles the incidence of cancers, on average (that large sample). So our 9 fold increase puts us to shame.
EPA on chlorination. This copy is from the Federal Register and sets out the confirmed side effects of outdated chlorination processes.
Cameron and Pauling. One of my favourite articles. These two rather clever people (well, Pauling has a Nobel Prize) took terminal untreatable cancer patients and achieved very good results. I think they might know something about oxidation!
This is only a brief list, so on to mental health:
Eby et al. Small study, but outstanding results. This suggests a trial of magnesium glycinate as supportive therapy should be a high priority. Of note is the comment that drinking water treatments strip magnesium out of water supplies, suggesting that high cancer rates and high rates of depression go hand in hand.
Rubenowitz et al. The counter opinion that alkalinity and magnesium protect against heart disease, but tactfully concludes that the effect is really due to magnesium alone (to avoid criticism from commercial interests, probably, such as the Chlorine Chemistry Council).
And to air pollution.
Ministry of Health. Research contracted out, Massey University mainly. Tested for Persistent Organic Pollutants (POPs) such as polychlorinated biphenols, dioxins and furans in mothers' milk. Insecticides are sources (decreasingly), as well as burning rubbish (increasingly). An example would be burning waste on a farm and mum drinking water from roof water collection, and smoke drift from towns entering the food chain via contaminated pasture. These POPs are passed on to baby with resultant developmental problems.
So, the Aim is?
In this election there is an opportunity for a clean sweep. The current model of goverance has done remarkably well considering just how overloaded our DHB has become - but it cannot continue, in my opinion, without earning the frustration of the Minister who expects fiscal responsibility and governance with vision.
Addition:
One difference in cancer incidence and ischaemic heart failure can be seen by comparing water supplies which adjust pH using lime to those which buffer the pH. Research on carneau pigeons illustrates the effect:
The first study, here, uses lime to adjust water pH in line with the vast majority of water supplies. The second article, here, uses a bicarbonate buffer instead of lime with the result that the detrimental effects in the first study are not found in the second. The second study was commissioned to refute the first but inadvertently confirmed that adjustment rather than buffering, all other factors controlled, was responsible for the formation of excess plasma cholesterol and reduced thyroxine T4. In real life terms this equates to a 30% reduction in both cancer and heart failure rates simply by using sodium hydroxide rather than lime to control acidity in water supplies.
When it comes to the nuts and bolts, sodium hydroxide can be put through equipment which doses with lime but not vice versa, i.e. hydroxide can go through existing equipment. Also, the cost of lime and sodium hydroxide are pretty much the same.
So, for a little effort and almost no expense, cancer and heart failure rates could come down by 30% in the year following a change to buffering, and stay down. Worthwhile, surely.
It just needs to get past the "you and whose army" reflex.
Together we can do it.
My latest post
The Government has, quite rightly I believe, identified cancer and mental health as two areas which need action. I am most encouraged by this acknowledgement and, like a great many others, I am sure I am not alone in being affected one way or another.
I think it would be easy, instead, to slide into fine tuning or re-prioritising treatment options to attempt to balance the books rather than take on the necessary improvements. An example might be, if a person is diagnosed with cancer then, rather than jumping to surgery or chemotherapy, treatment might involve stabilising the tumour or slowing its growth so that in practical terms the cancer has no adverse effect on a person's quality of life - and they pass away in their allotted time of old age before the cancer advances sufficiently to be a problem. This saves a little on costs and improves our patient's quality of life.
That is arguably a more clever way of treatment than the current slash and burn approach, but on its own the effect on our health care system is negligible. The real improvements come when our cancer patient doesn't get cancer in the first place.
So I maintain that our focus has to be prevention - and, yes, we can be clever with better treatments in addition to prevention.